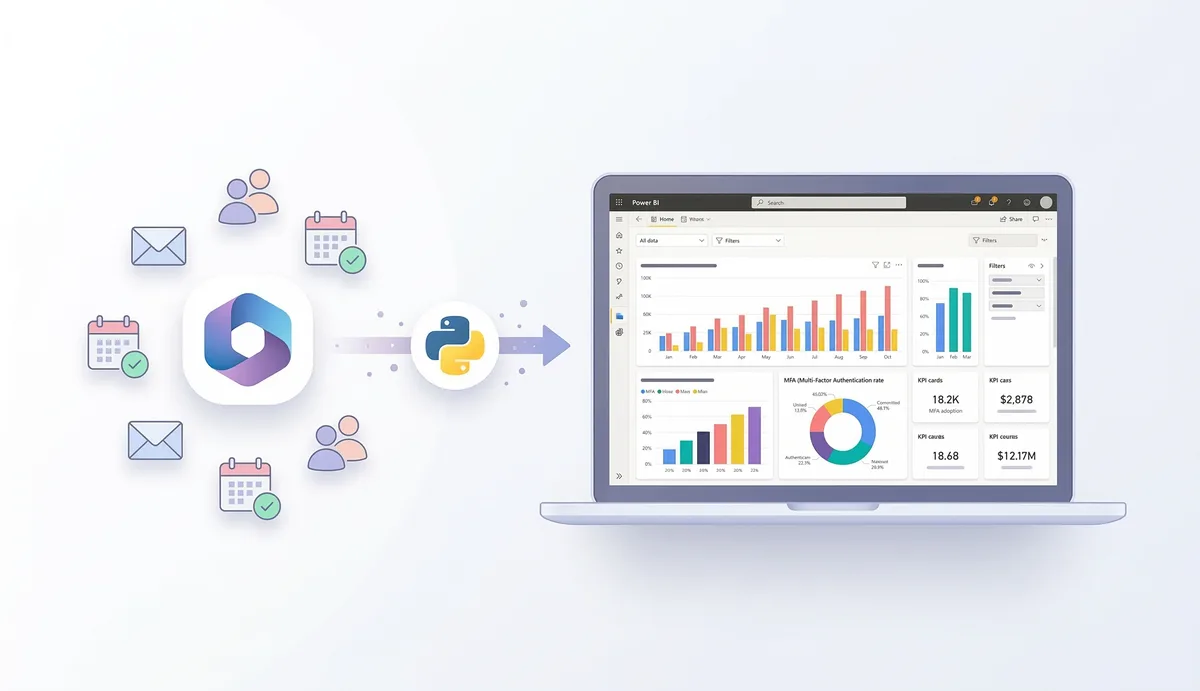
TL;DR: I built a Power BI dashboard showing MFA adoption, active users and security metrics from Microsoft 365. It all runs from a laptop: a Python script pulls data from Microsoft Graph, generates CSVs, and Power BI visualizes them. No cloud infrastructure, no intermediate servers.
The Problem
Microsoft 365 generates tons of operational data - authentication, user activity, service adoption, security. But that information is scattered across different admin portals and APIs.
I wanted a single view where IT and security could see the state of the environment at a glance.
The Architecture (deliberately simple)
Microsoft Graph API
        │
        │  Python script (local laptop)
        ▼
    CSV files
        │
        ▼
    Power BI Desktop
        │
        ▼
    Interactive dashboard
No Azure Functions, no Data Factory, no dataflows. A script that runs manually, generates CSVs, and Power BI consumes them. Working prototype, not enterprise architecture.
The Metrics That Matter
Security and MFA: users registered for MFA vs without, authentication methods, strong auth adoption rate.
Identities: total users, guests, admin accounts.
Activity: active users, last sign-in, M365 app usage.
Key Graph endpoints: /reports/authenticationMethods/userRegistrationDetails for MFA, /users and /directoryRoles for identities, /reports/getOffice365ActiveUserDetail for activity.
The Pipeline
1. Authentication
App Registration in Entra ID with Reports.Read.All, User.Read.All, Directory.Read.All permissions. Credentials in environment variables (never in code). If you’re protecting resources behind this identity, SSO with Google Workspace and Cloudflare is a clean pattern for access control.
The script uses MSAL to get a token and calls Graph:
app = ConfidentialClientApplication(
    client_id=os.getenv("CLIENT_ID"),
    authority=f"https://login.microsoftonline.com/{os.getenv('TENANT_ID')}",
    client_credential=os.getenv("CLIENT_SECRET")
)
token = app.acquire_token_for_client(
    scopes=["https://graph.microsoft.com/.default"]
)
2. Extraction → CSV
Each endpoint is queried, normalized with pandas, exported to CSV. MFA example:
response = requests.get(
    "https://graph.microsoft.com/beta/reports/authenticationMethods/userRegistrationDetails?$top=999",
    headers={"Authorization": f"Bearer {token}"}
)
df = pd.json_normalize(response.json().get("value", []))
df.to_csv("mfa_registration.csv", index=False)
3. Power BI
Get Data → CSV → load. DAX measures for KPIs:
Users with MFA = CALCULATE(COUNTROWS(MFA_Table), MFA_Table[isMfaRegistered] = TRUE)
Users without MFA = CALCULATE(COUNTROWS(MFA_Table), MFA_Table[isMfaRegistered] = FALSE)
Dashboard with KPIs up top (total users, MFA adoption rate, active users, admin accounts) and charts below (MFA method distribution, activity, trends).
The Role of the LLM
I used an LLM as an assistant throughout development: initial script generation, Graph API error debugging, data model structuring, DAX measure optimization, and documentation.
It doesn’t replace technical knowledge - you need to know what to ask and validate the answers. But it significantly accelerates the development cycle. Tasks that would take 30 minutes of Googling + copying from StackOverflow get resolved in 2 minutes of conversation.
The Limitations (brutal honesty)
Manual execution. The dashboard only updates if you run the script. No automatic refresh.
Beta endpoints. The MFA report lives in Graph beta - Microsoft can change it without notice.
Doesn’t scale. For enterprise environments you need Azure Functions, Data Factory, or Power BI Dataflows with scheduled refresh.
Secrets. Environment variables are better than hardcoding, but the ideal would be Azure Key Vault with Managed Identities.
This is a working prototype for local analysis. If you need something for enterprise production, you need more infrastructure.
What I Learned
Graph API is powerful but fragmented. The metrics you need are in different endpoints, with different formats, and some only in beta. Patience.
CSV as an intermediary works. For prototypes, you don’t need a database. Python → CSV → Power BI is a pipeline any IT admin can maintain.
Power BI shines with clean data. The heavy lifting is extraction and normalization. Once the CSVs are well-structured, Power BI does the rest almost by itself.
LLMs as development accelerators. Not as replacement, but as multiplier. The combination of your own technical knowledge + LLM assistance is very powerful for projects like this.
By: Cesar Rosa Polanco - Based on a real case, with editorial support from artificial intelligence.